Client
FacebookType
WebGL Data VizRole
Dev, 3D Design
The Problem
Facebook approached ISL in March 2015 to create a data visualization of Facebook Trends the Facebook Trends API for their F8 developer conference. The project had a hellishly tight timeline, with concepting, design, and development packed into 8 weeks. This was my first WebGL project and first 3d project. It was a rousing success, and after F8 we rebuilt it as a full product for Facebook's offices and events.
Read on or just fool around with it now.
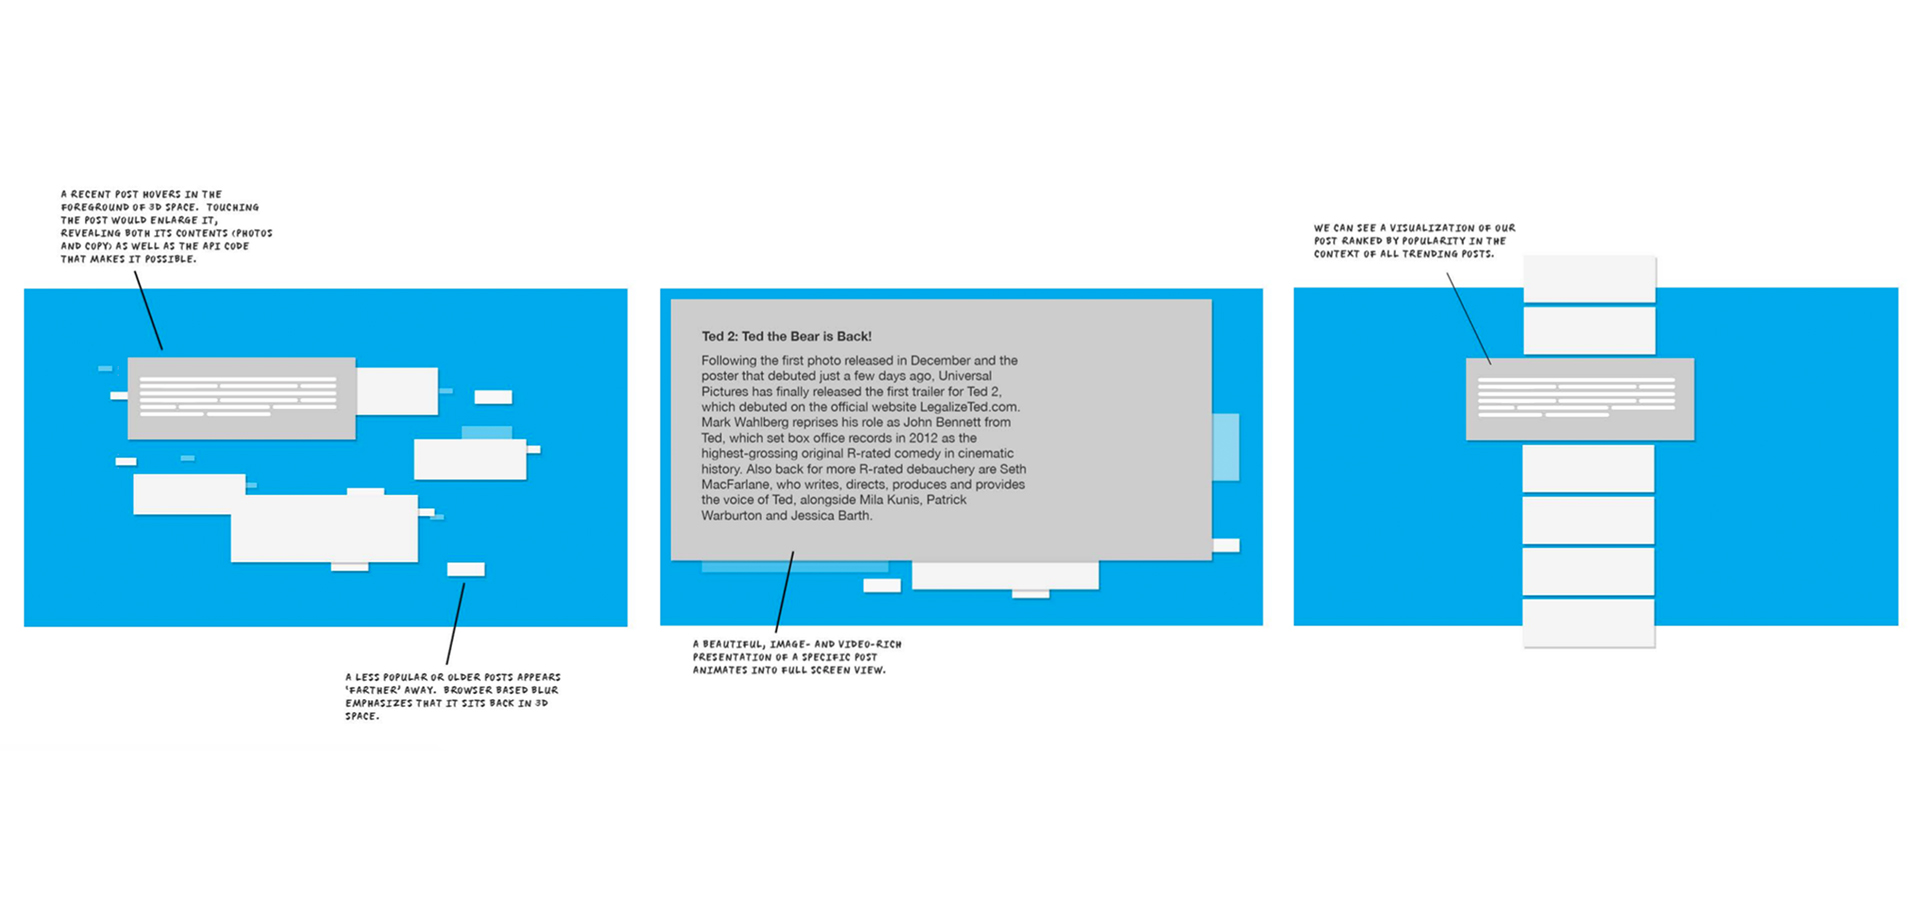
A tour of the viz.
Concepting
We knew that it would be a highly visible installation at the conference, seen on several 80" touch displays. 3d was decided upon at the beginning, in order to create something as visually engaging and interesting as possible. ISL pitched a concept that invovled cards that floated in 3d space, with API calls on one side and the returned data on the other. Facebook liked the idea, but we knew we could do better.
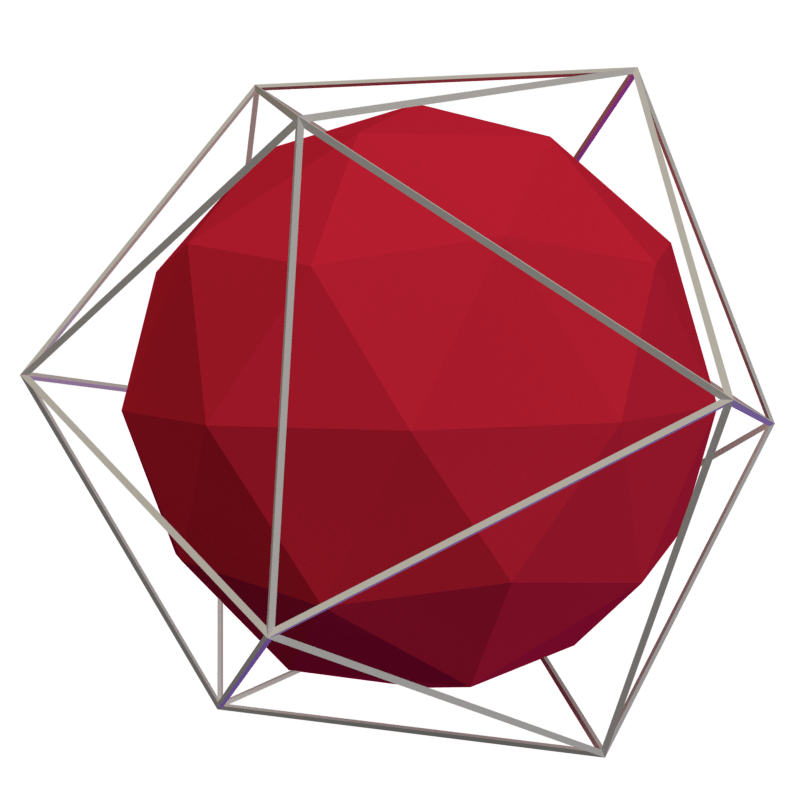
After we realized that the F8 is as much for media folks and marketers as it is for developers, I floated the idea of representing trends as a whirling galaxy of shapes rather than cards. Tapping each "solar system" would take you into that individual trend, with the Facebook posts that make up the trend represented as planets. It might be less strictly informative, but far more fun to interact with (and also way more challenging to build, we'll get to that).
Prototyping planet orbits
Iteration
Due to the crazy time crunch, and both the lack of experience both the designer (100% certified BOSS, Maggie Gaudaen) and I had with 3D, we were much more collaborative in design. We iterated like crazy. The galaxy of shapes was quickly ruled out, simply because it would take far too much time to actually build the thing. We moved on to a concept representing each trend as an atom within a molecule, and each post as an orbiting electron.
The first cloud of shapes.
We progressed fairly far with the molecule concept, but ended up ditching the orbiting posts. We felt that they created a lot of visual noise and confusion, and was concerned that people would want to interact with them and grow frustrated as they were moving too fast to hit with a tap.
Now with electron orbiters.
We decided on an abstract cloud of floating 3d shapes. Tapping a shape zooms in the camera and reveals smaller 3d shapes representing posts from inside the trend shape. Tapping on a post takes reveals the content of that post.
Development
Development left the prototyping stage with roughly five weeks left in the timeline. I had limited experience working with WebGL, Three.js, or 3d in general. I was also sole developer on the visualization. This project would be seen and physically touched by hundreds of conferencegoers, including folks at The Verge, Gizmodo, Techcrunch, etc. Yes, that is exactly as shitty and terrifying as it sounds.
The vizualization used Angular 1.6 on the front end, mostly for structure, organization, views and routing. The backend was a node.js social aggregator tool called Grandstand, built by ISL back in the good ol days.
I cranked the app out so quickly that significant performance problems crept into the build. The app was simply doing too much on a frame to frame basis. This bit us in the ass when we had to specify gaming PCs just to run this WebGL experience smoothly at 1080p.
That said, despite the fact that the codebase looked every bit like a mad dash for the finish line, because it was, the app shipped on time, nothing caught fire, and nobody died.
F8 Success
Trends Viz was a tremendous success at F8. People loved using it, CNN and HLN inquired about using it on-air.
Facebook asked us to create version 2, a stable product, for future events and as a permanent installation in their offices.
Tell this guy to stop touching my stuff.
The Product
It's not often you get a chance to undertake a clean-slate rebuild of a project you care about, and I didn't let this one go to waste.
I completely rearchitected the application. It's completely modular, and built as a generic 3d visualization platform that takes a dataset, parameters to describe the 3d objects, and an interaction callback. You wanted to have a cloud of 3d cats representing the internet's famous felines? Easy peasy. The platform should see the light of day as open source soon.
The app was rebuilt from the ground up with performance in mind. I used web workers to push as much computation as possible onto background threads, limiting per-frame operations, and simplified vignetting & blurring. The performance gains were simply bonkers. What required a gaming PC before will now comfortably run on old-ish mobile devices, chromecasts, you name it.
These changes were supplemented by a ground-up rebuild of our social backend, and the creation of an admin panel that lets Facebook curate trends for the visualization.